This is part of a series on Learning from the Top Sending Campuses in Cru.
See the intro for a full list of all the campuses profiled (and links to each).
The chart below shows staff allocation and student need for each of the 10 Cru regions.
A helpful clarification as to how Cru works: Cru is divided into 10 regions (I’ve listed the states in each region at the bottom of this post). Generally, staff and interns that are raised up in a region stay in the same region. Staff and interns are placed by the regional team (with interns typically staying on the same campus from which they graduated). Interns and staff can request to go to another region, but that is not the norm (and involves not a small amount of coordination between regions).
In the past (I’m not sure what year - maybe pre-1991?) staff allocation was done nationally. I may be wrong, but I’ve heard that staff were intentionally sent out of their region – i.e.- if you went to school in Texas you would be placed on staff in New Hampshire.
A quick explanation of the columns:
- Total FT = Staff + Interns in a region (as of 2013)
- Sending FT = how many interns and staff that region raised up in 2014 (doesn’t count sending to STINT). I think this is helpful to see the trajectory of manpower for that region (i.e. – ____ may not have a lot of staff right now but they are currently raising up a lot; or _____ doesn’t have enough staff and there’s no help on the way unless it comes from the outside)
- Students = how many total college students in each region (thanks to Scott Crocker for compiling these via The Chronicle of Higher Education Almanac & Open Doors Report. Numbers were published Fall 2014 & represent 2012-2013 School Year)
- Students/FT = the staff to student ratio – how many students each staff needs to reach with the gospel. “The laborers are few.”
- Involved = how many students are involved with Cru in that region
- Involved % of whole = what percentage of college students in that region are involved with Cru
- Involved/FT = the staff to involved student ratio – how many students are involved per full time Cru worker (staff & intern). This stat includes moms who are not full time on campus (most work 4-8 hours/week), which definitely distorts the numbers a bit; i.e. – on our campus we have 36 students involved/staff if you just count full time staff/interns on campus (not counting moms). 26 students/staff if you count moms.
| Total FT | Sending FT | Students | Students/FT | Involved | Involved % of whole | Involved/FT | |
| Great Lakes | 378 | 150 | 2,717,402 | 7,189 | 9,232 | 0.34% | 24 |
| Great Plains | 198 | 47 | 1,358,845 | 6,863 | 4,119 | 0.30% | 21 |
| Greater Northwest | 137 | 21 | 1,211,181 | 8,841 | 1,592 | 0.13% | 12 |
| Mid-Atlantic | 180 | 57 | 2,511,805 | 13,954 | 4,945 | 0.20% | 27 |
| Mid-South | 217 | 64 | 1,470,910 | 6,778 | 5,742 | 0.39% | 26 |
| Northeast | 155 | 35 | 2,350,253 | 15,163 | 2,796 | 0.12% | 18 |
| Pacific Southwest | 206 | 95 | 3,474,494 | 16,866 | 3,580 | 0.10% | 17 |
| Red River | 208 | 84 | 2,222,204 | 10,684 | 4,084 | 0.18% | 20 |
| Southeast | 147 | 65 | 2,197,268 | 14,947 | 5,140 | 0.23% | 35 |
| Upper Midwest | 197 | 69 | 1,300,398 | 6,601 | 8,064 | 0.62% | 41 |
| 2,023 | 687 | 20,814,760 | 10,289 | 49,294 | 0.24% | 24 |
What can we learn from this?
- First off, I think it’s good to remember that while there is a lot of work to be done in the U.S., the need is still far greater overseas. There are thousands of campuses with no Christian witness. In just one region in East Asia where we send to, the population is the same as the U.S. and they have 50 staff to reach it (we have 34x that in the U.S.!).What can we learn from this?
- The need is great. We have 1 Cru staff for every 10,000 college students in the U.S.. If you took 1,000 college students at random, 2 of them would be involved in Cru.
- The regions with the most need (based on student/FT ratio):
- Pacific Southwest
- Southeast
- Northeast
- Mid-Atlantic
- Of those, the Northeast has the greatest need – based on the pipeline of new laborers. I’m not sure what the rate of attrition is (people leaving staff/internships) but I’d guess that 35 new laborers/year is not enough to stay laborer neutral (much less grow).
- I think the Involved/FT column is a great indicator of spiritual soil.
- The hardest places to grow a movement:
- Greater Northwest
- Pacific Southwest
- Northeast
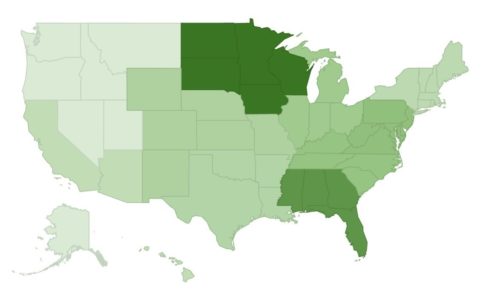
Thanks to Karl Udy for putting together these maps!
- The hardest places to raise up laborers:
- Greater Northwest
- Northeast
- It’s striking to see that the Upper Midwest has twice as much gospel saturation as any other region. Not that .6% is thorough saturation by any stretch that means that out of 1,000 students on every campus in that region, 6 are involved with Cru. But far (6x!) closer to “everyone knowing someone that passionately follows Jesus” than the PSW, Northeast, and Greater Northwest with 1 passionate follower of Christ for every 1,000 students.
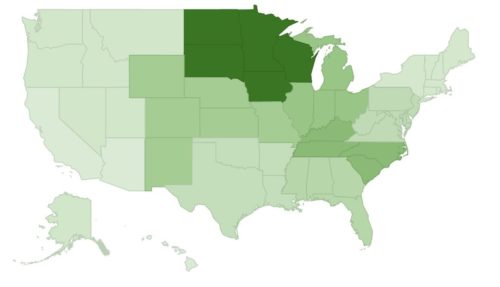
- Every year the Great Lakes is raising up as many Full Time Laborers (FT) as the entire Northeast region (of course that includes interns who will likely only serve for 1-2 years)
- I think this map is helpful. It’s the population at large (not just college students), but it shows the percentage of Evangelical Protestants and Mormons (?!) in different regions of the U.S. (the NYTimes has a clickable version where you can see % for each county):
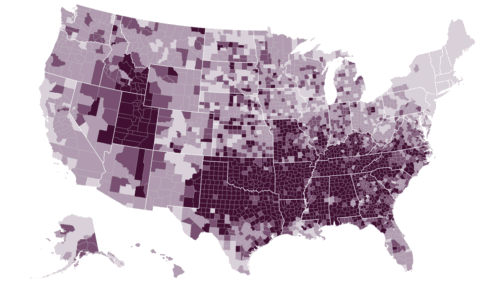

- See that nice, clean gray space in the Northeast? And that map puts into perspective what God has done in raising up such strong Cru movements in the Upper Midwest and Great Lakes where there are far fewer Christians (than the south). May He do the same in the Northwest, Northeast, and Pacific Southwest.
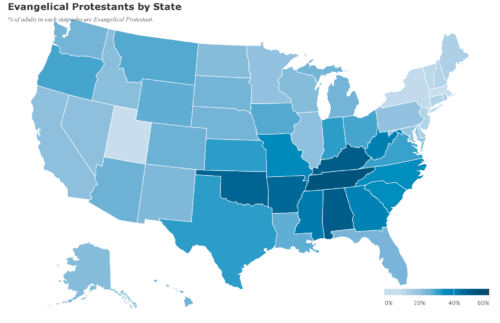
- This map (via Pew Forum) might be more helpful- it just shows Evangelicals (sans Mormons):
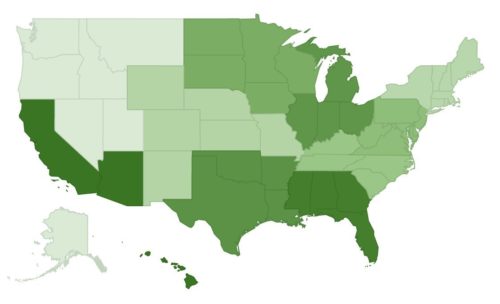
- Another interesting ratio – number of laborers (interns and staff) a region raises up per existing laborer:
What can we do about the needs?
- I am not advocating for a return to the days of national staff allocation. I think that breeds resentment in staff (who are sent out) and teams (whose staff are pried away).
- I’m a big fan of empowering leaders by showing them a problem or a need and asking them to be a part of the solution.
- What I would love to see is a grassroots movement of campuses sending to where there is a need. A local-level driven movement where teams sacrificially send to the world and to more needy areas of the country. A mentality of “send first” and trusting God that He’ll provide the staff we need to reach our own campus.
I would love to hear what you think: What do you see as you look at the data?
States in each Cru region:
Great Lakes –Â Illinois, Indiana, Michigan, Ohio
Great Plains -Â Colorado, Kansas, Missouri, Nebraska, New Mexico, Wyoming
Greater Northwest -Â Alaska, Idaho, Montana, Nevada, Oregon, Utah, Washington
Mid-Atlantic -Â Delaware, Maryland, New Jersey, Pennsylvania, Virginia W., Virginia, D.C.
Mid-South -Â Kentucky, N. Carolina, S. Carolina, Tennessee
Northeast Region -Â Connecticut, Maine, Massachusetts, New, Hampshire, New York, Rhode Island, Vermont
Pacific Southwest -Â Arizona, California, Hawaii,
Red River -Â Arkansas, Louisiana, Oklahoma, Texas
Southeast -Â Alabama, Florida, Georgia, Mississippi
Upper Midwest –Â Iowa, Minnesota, North Dakota, South Dakota, Wisconsin