This is the best idea I’ve ever come across for planning.
How do you take all that is going on in your movement (the good and bad) and all you hope to accomplish (with often conflicting team opinions on what we should focus on next) and make sense of it all to determine what your team needs to focus on in the fall?
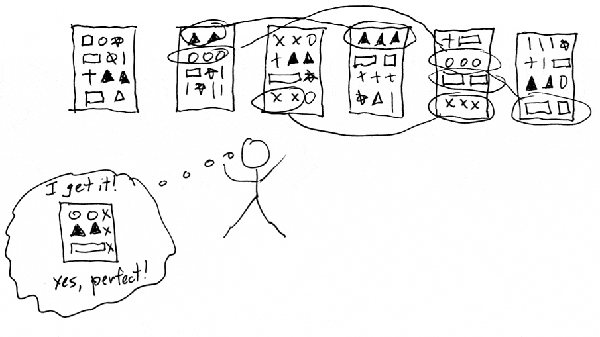
A few years ago I read the book The Back of the Napkin by Dan Roam. The author described a brilliant way to take a LOT of information/issues/problems and emerge with THE best solution. We’ve found this approach to be incredibly effective and a lot of fun (something no one has ever accused PrEFACE of!).
Roam calls it the garage-sale principle:
“Regardless of how well organized all the stuff in our garage may be, laying everything out on tables in the light of day yields a completely new perspective on it all. The same is true of data: when it is packed away in individual files and records, it’s impossible to look at the big picture — but getting everything out in the open makes otherwise invisible connections visible… great ideas emerged as people really looked at everything for the first time.”
The single best way to effectively to look at a lot of data is to take everything we’ve collected and lay it out side by side, where our eyes can scan it all in a few passes.
So how do you set it up?
- Gather all the information (this is actually the hardest work) — get accurate stats on EVERYTHING you can. Send out staff evals to have them evaluate the current reality of the movement (here’s two we use: 1 & 2).
- Print out all your data and information about your current reality on sheets of paper and really big sticky notes.
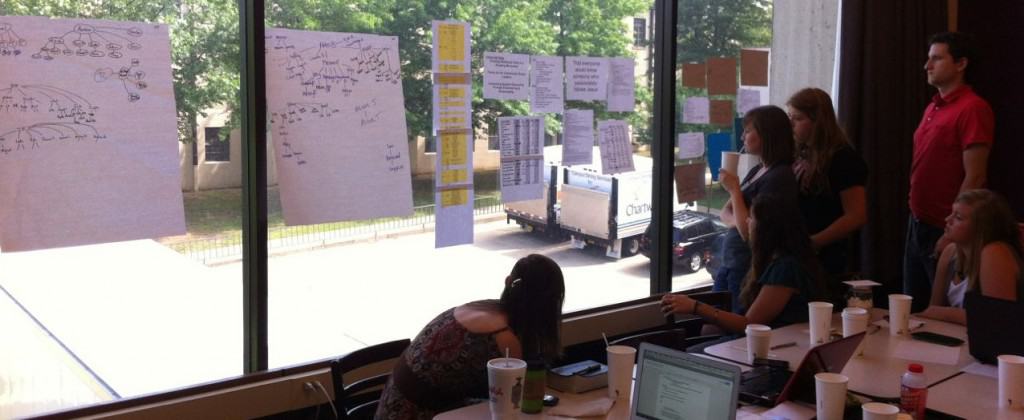
- For staff planning get a conference room and cover every inch of wall with information on the current reality of your movement.
- You want both:
- Qualititative analysis of your movement (pictures, descriptions)
- We have everyone draw a picture of our movement and then share it with the team
- “What words or phrases would you use to describe the feel of our movement?”
- Quantitative (numbers, spreadsheets!)
- Now, I know some of you may balk at spreadsheets — I mean we are about lives being changed not numbers. But Dan Roam sums it up well: “spreadsheets are excellent tools for spreading out a lot of data on a single sheet.”
- And without fail, numbers are what bring the most productive ideas for change as we can quickly see where we are doing well and where we are lacking.
- Then give everyone a few minutes just to take it all in.
- And ask something simple like, “what do you see?”
Once you lay out all the information in front of you, you can then begin to see it with more clarity.
You begin to see:
- patterns (“we’ve had the same number of freshmen for 4 years straight” or “we’ve seen fewer people come to Christ each year”),
- contradicting data (“this doesn’t make sense: we did WAY more first week surveys this year but the exact same number of freshmen as always — why?”),
- what we are doing well at
- where there are gaping holes
Here’s some of what we put up on the wall:
- 5 Year Goals (which is an entire page of dreams we have for 2015)
- Priority steps from our Strategic Plan from this past year (a reminder of what we focused on)
- Goals for the year (that we brainstormed in Aug 2011) vs. reality now
- Year Calendar (just to refresh memories on what we did this year):
- Fall
- Move-in week (cookouts)
- First week — Surveys and Dorm Studies
- Fall Retreat
- TWC
- Spring
- Leadership Retreat
- Spring Break Trips
- Fellowship Dinner
- Legacy Dinner
- Our Vision Statement — printed big on a page:
- That everyone would know someone who passionately follows Jesus
- The following stats are most effective if you can compare to the last few years
- # of Community Group Leaders (going into the fall)
- # in Community Group (broken down by guys/girls AND fish/soph/jr/sr)
- Trusted Christ
- Summer Project (# applied AND # going)
- Fall Retreat #’s
- Winter Conference #’s
- Legacy Dinner attendance (end of year banquet)
- Involved New Believers
- M29 Leadership (# attending weekly Leadership meeting)
- Cru #’s avg in the Fall
- # at last Cru in the Spring
- # at Cru 1st week in Fall
- # of 1st Week Spiritual Interest Surveys
- # in Dorm Studies (big co-ed studies we do week 1&2 in fall)
- Freshman in CG in April
- Intern/Stint/Staff (how many laborers raised up in each of these categories)
- Number Men/Women Discipled (start of fall/end of spring)
- Seniors Sent
- Times shared gospel (broken down by: 1st 4 weeks/rest of fall/spring)
As we look at it all, we record staff’s thoughts on big stickies under three categories:
- Holes (“wow, we did not share our faith much this spring”)
- Sustained Growth (how do we improve on what we are already good at? — “we’ve seen a big jump in SP #’s, how do we keep momentum there?”)
- Connections (not sure if it’s a strength or weakness — just an observation: “it seems like our studies that did really well were led by juniors”)
At the end we give our staff 3-4 minutes to write their initials next to three things they think we should dig into more (and focus on during planning).
Out of that comes our 3-4 Priority Steps for the Fall.
Would love to hear from you:
- What stats do you track year to year?
- What do you do in your planning for the fall?
- What Evals do you use?
Feel free to email me if you want more details on any of this (like I can send you the spreadsheet we use to track things!): timDOTcasteelATuscmDOTorg


